
Analytics and client reports
In Maeve you can see how every account is doing in one place, down to the numbers on a single post. When a client wants to see it, send them a branded PDF, or have Maeve email them one every week or month.
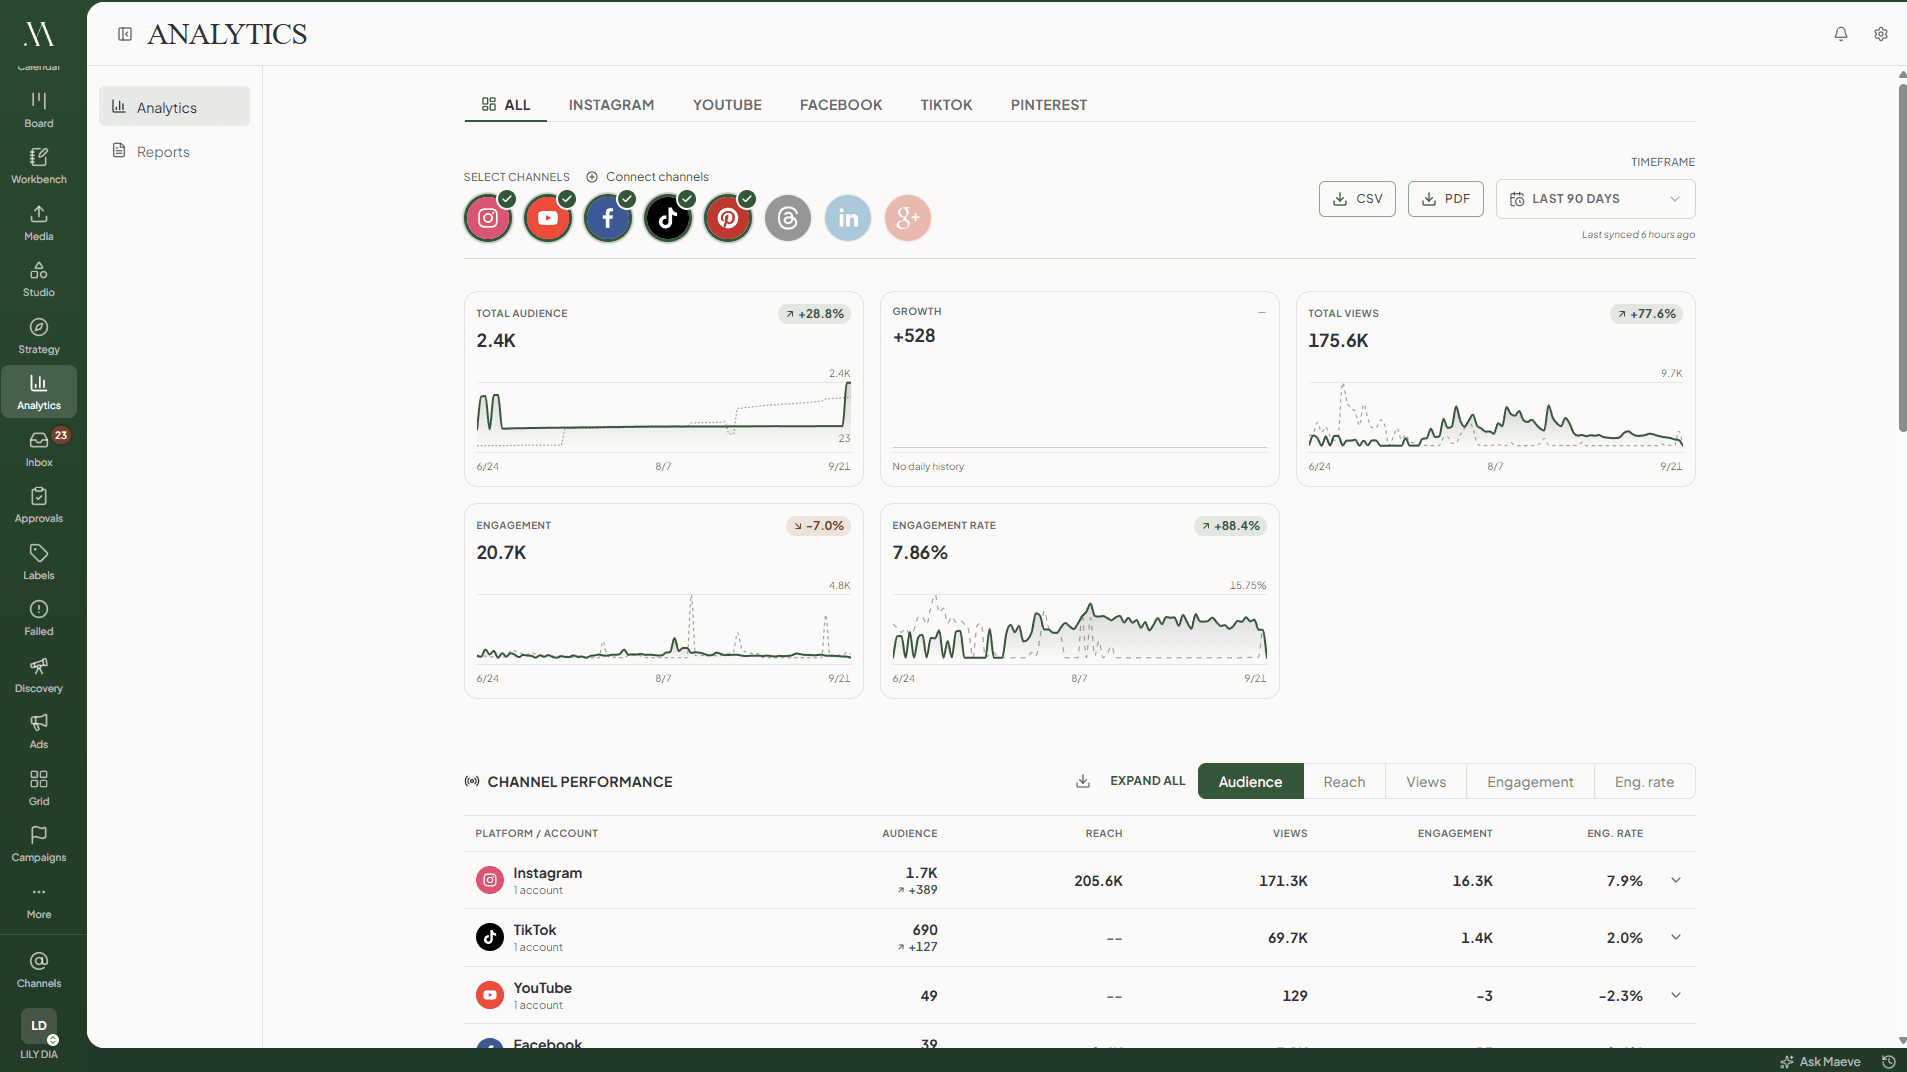
Every number, with its own chart
Pick an account and you get its metrics laid out together, each one drawn over the period you chose.
The dotted line behind each chart is the period before, so you can see at a glance whether this month beat last month.
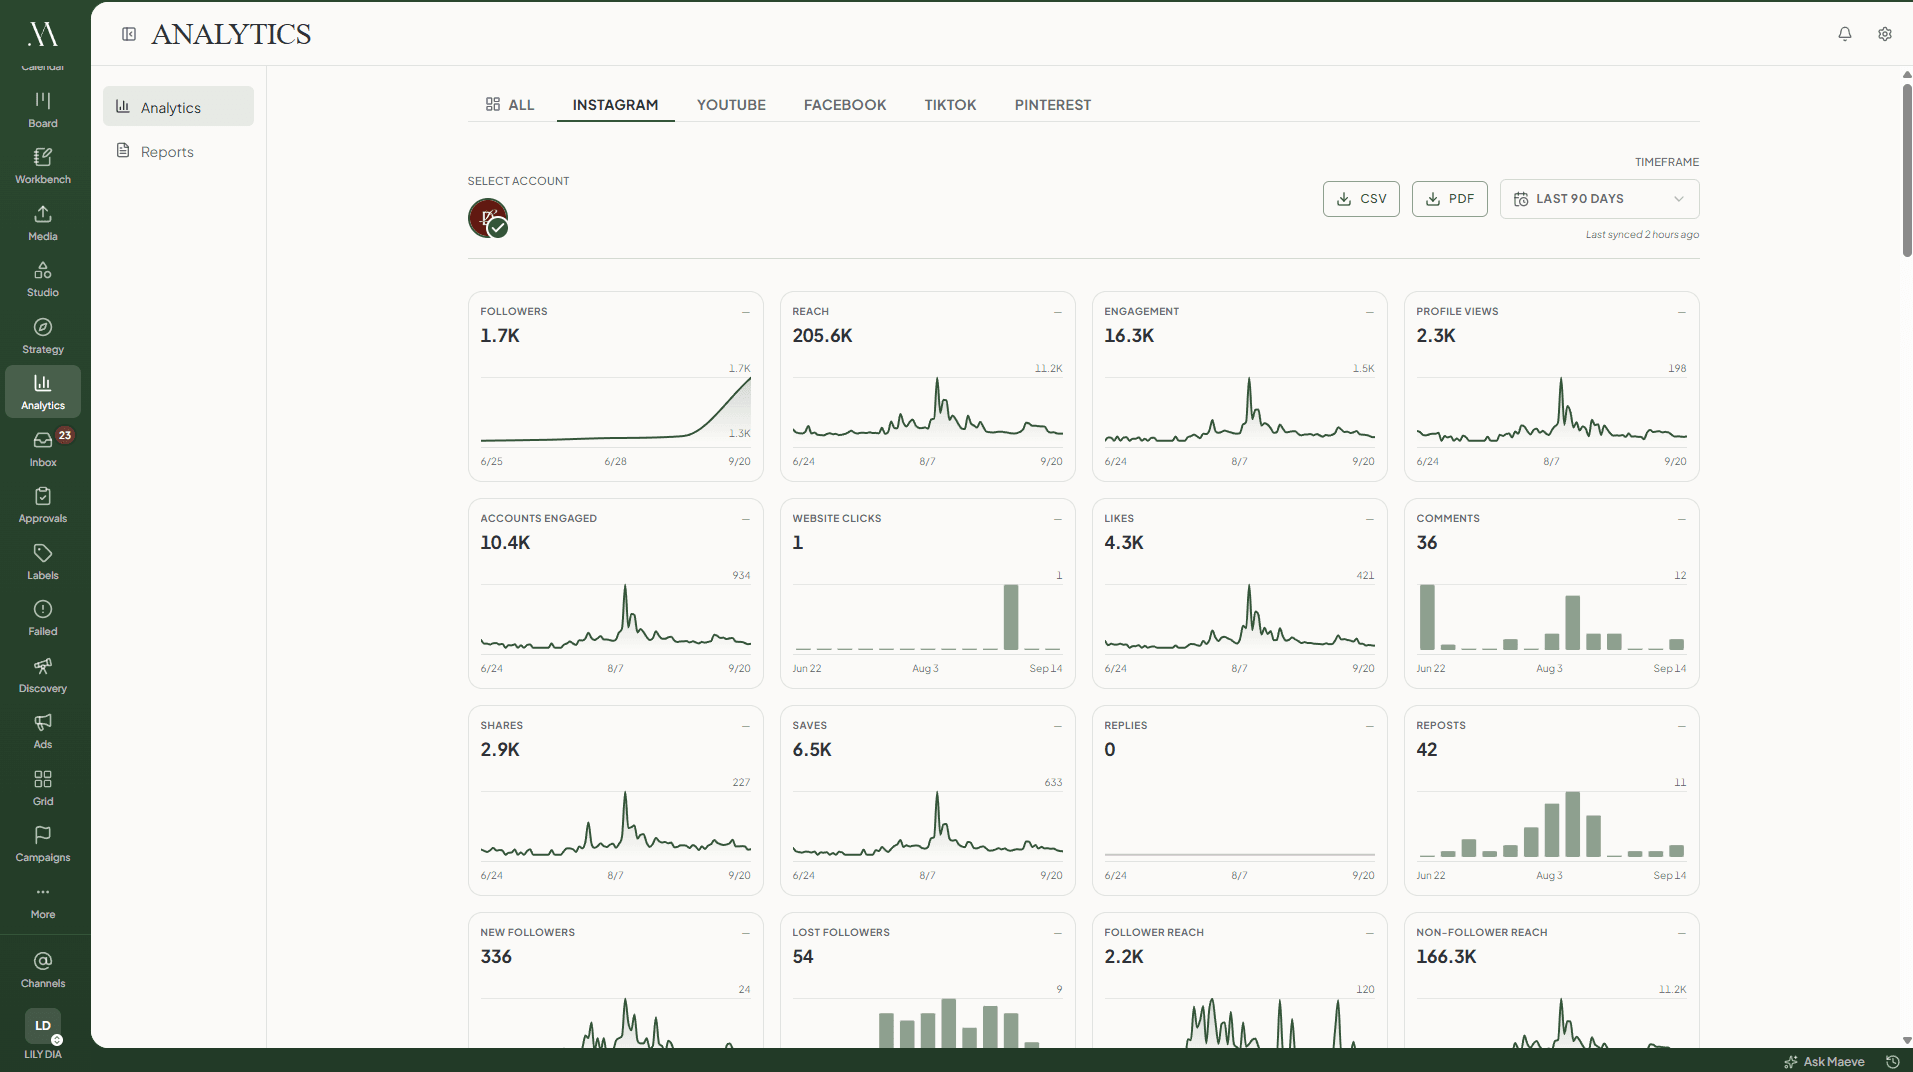
What we support
Eight networks report into Maeve. They do not all hand over the same things, so here is what you get from each one.
Where a network keeps something to itself, Maeve says so rather than filling the gap with a number it made up.

Analytics
| Network | Audience | Views | Per post | Audience data |
|---|---|---|---|---|
| Yes | Yes | Yes | Yes | |
| Yes | Yes | Yes | Yes | |
| YouTube | Yes | Yes | Yes | Yes |
| TikTok | Yes | Yes | Yes | Yes |
| Yes | Yes | Yes | No | |
| Threads | Yes | Yes | Yes | No |
| Yes | Yes | Yes | No | |
| Google Business | No | Yes | No | No |
Audience data means age, gender and location, and every network holds it back until an account is big enough. X has no analytics.
See what people actually did
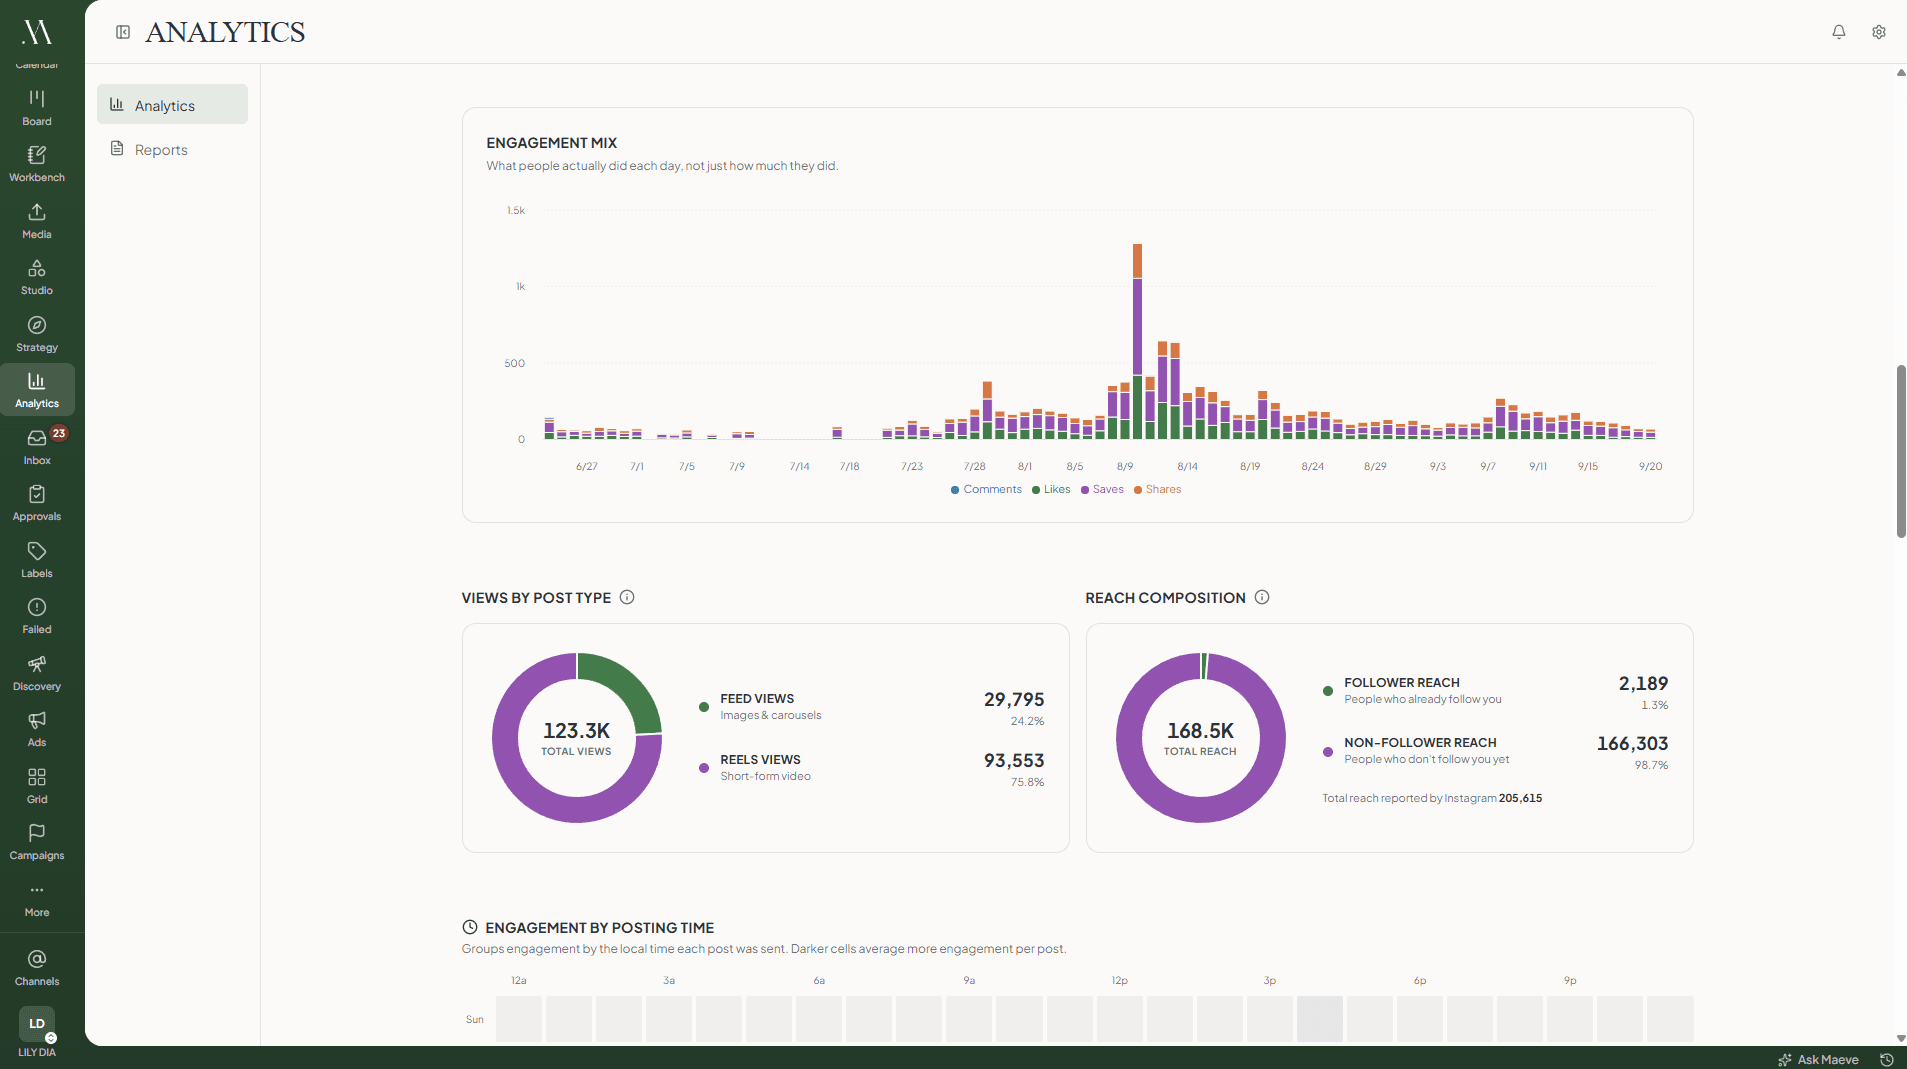
Likes, comments, saves and shares day by day, so you can tell a post people saved from a post people scrolled past.
On Instagram you also see how much of your reach came from people who do not follow you yet, and how views split between feed and Reels.
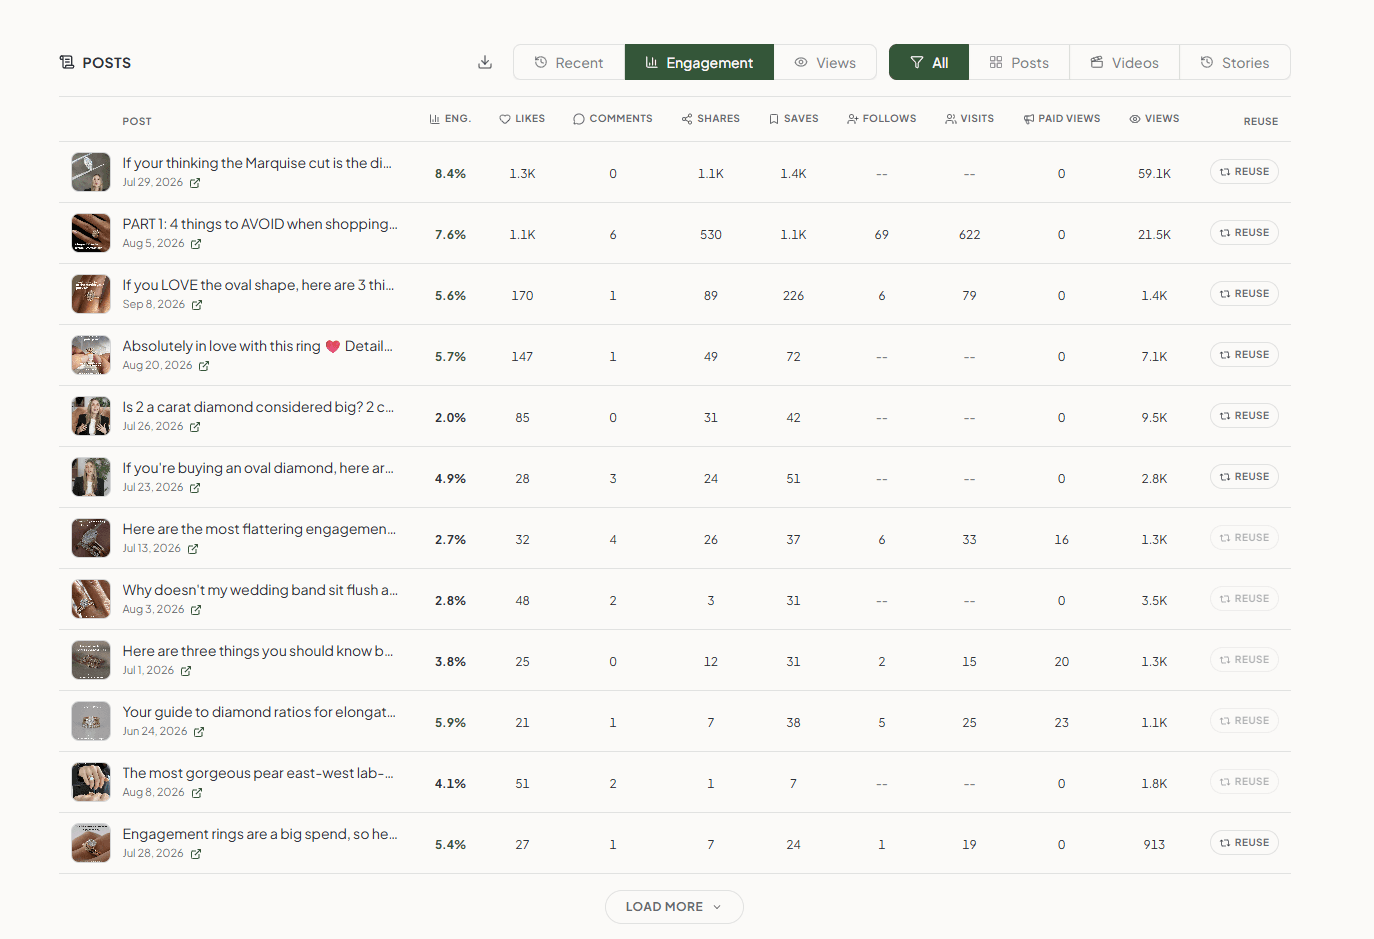
Find the posts worth doing again
Every post you published in the period, with its own numbers. Sort by engagement or views to see what worked.
Hit reuse on a good one and it opens in the composer, ready to schedule again.
Send your client a PDF
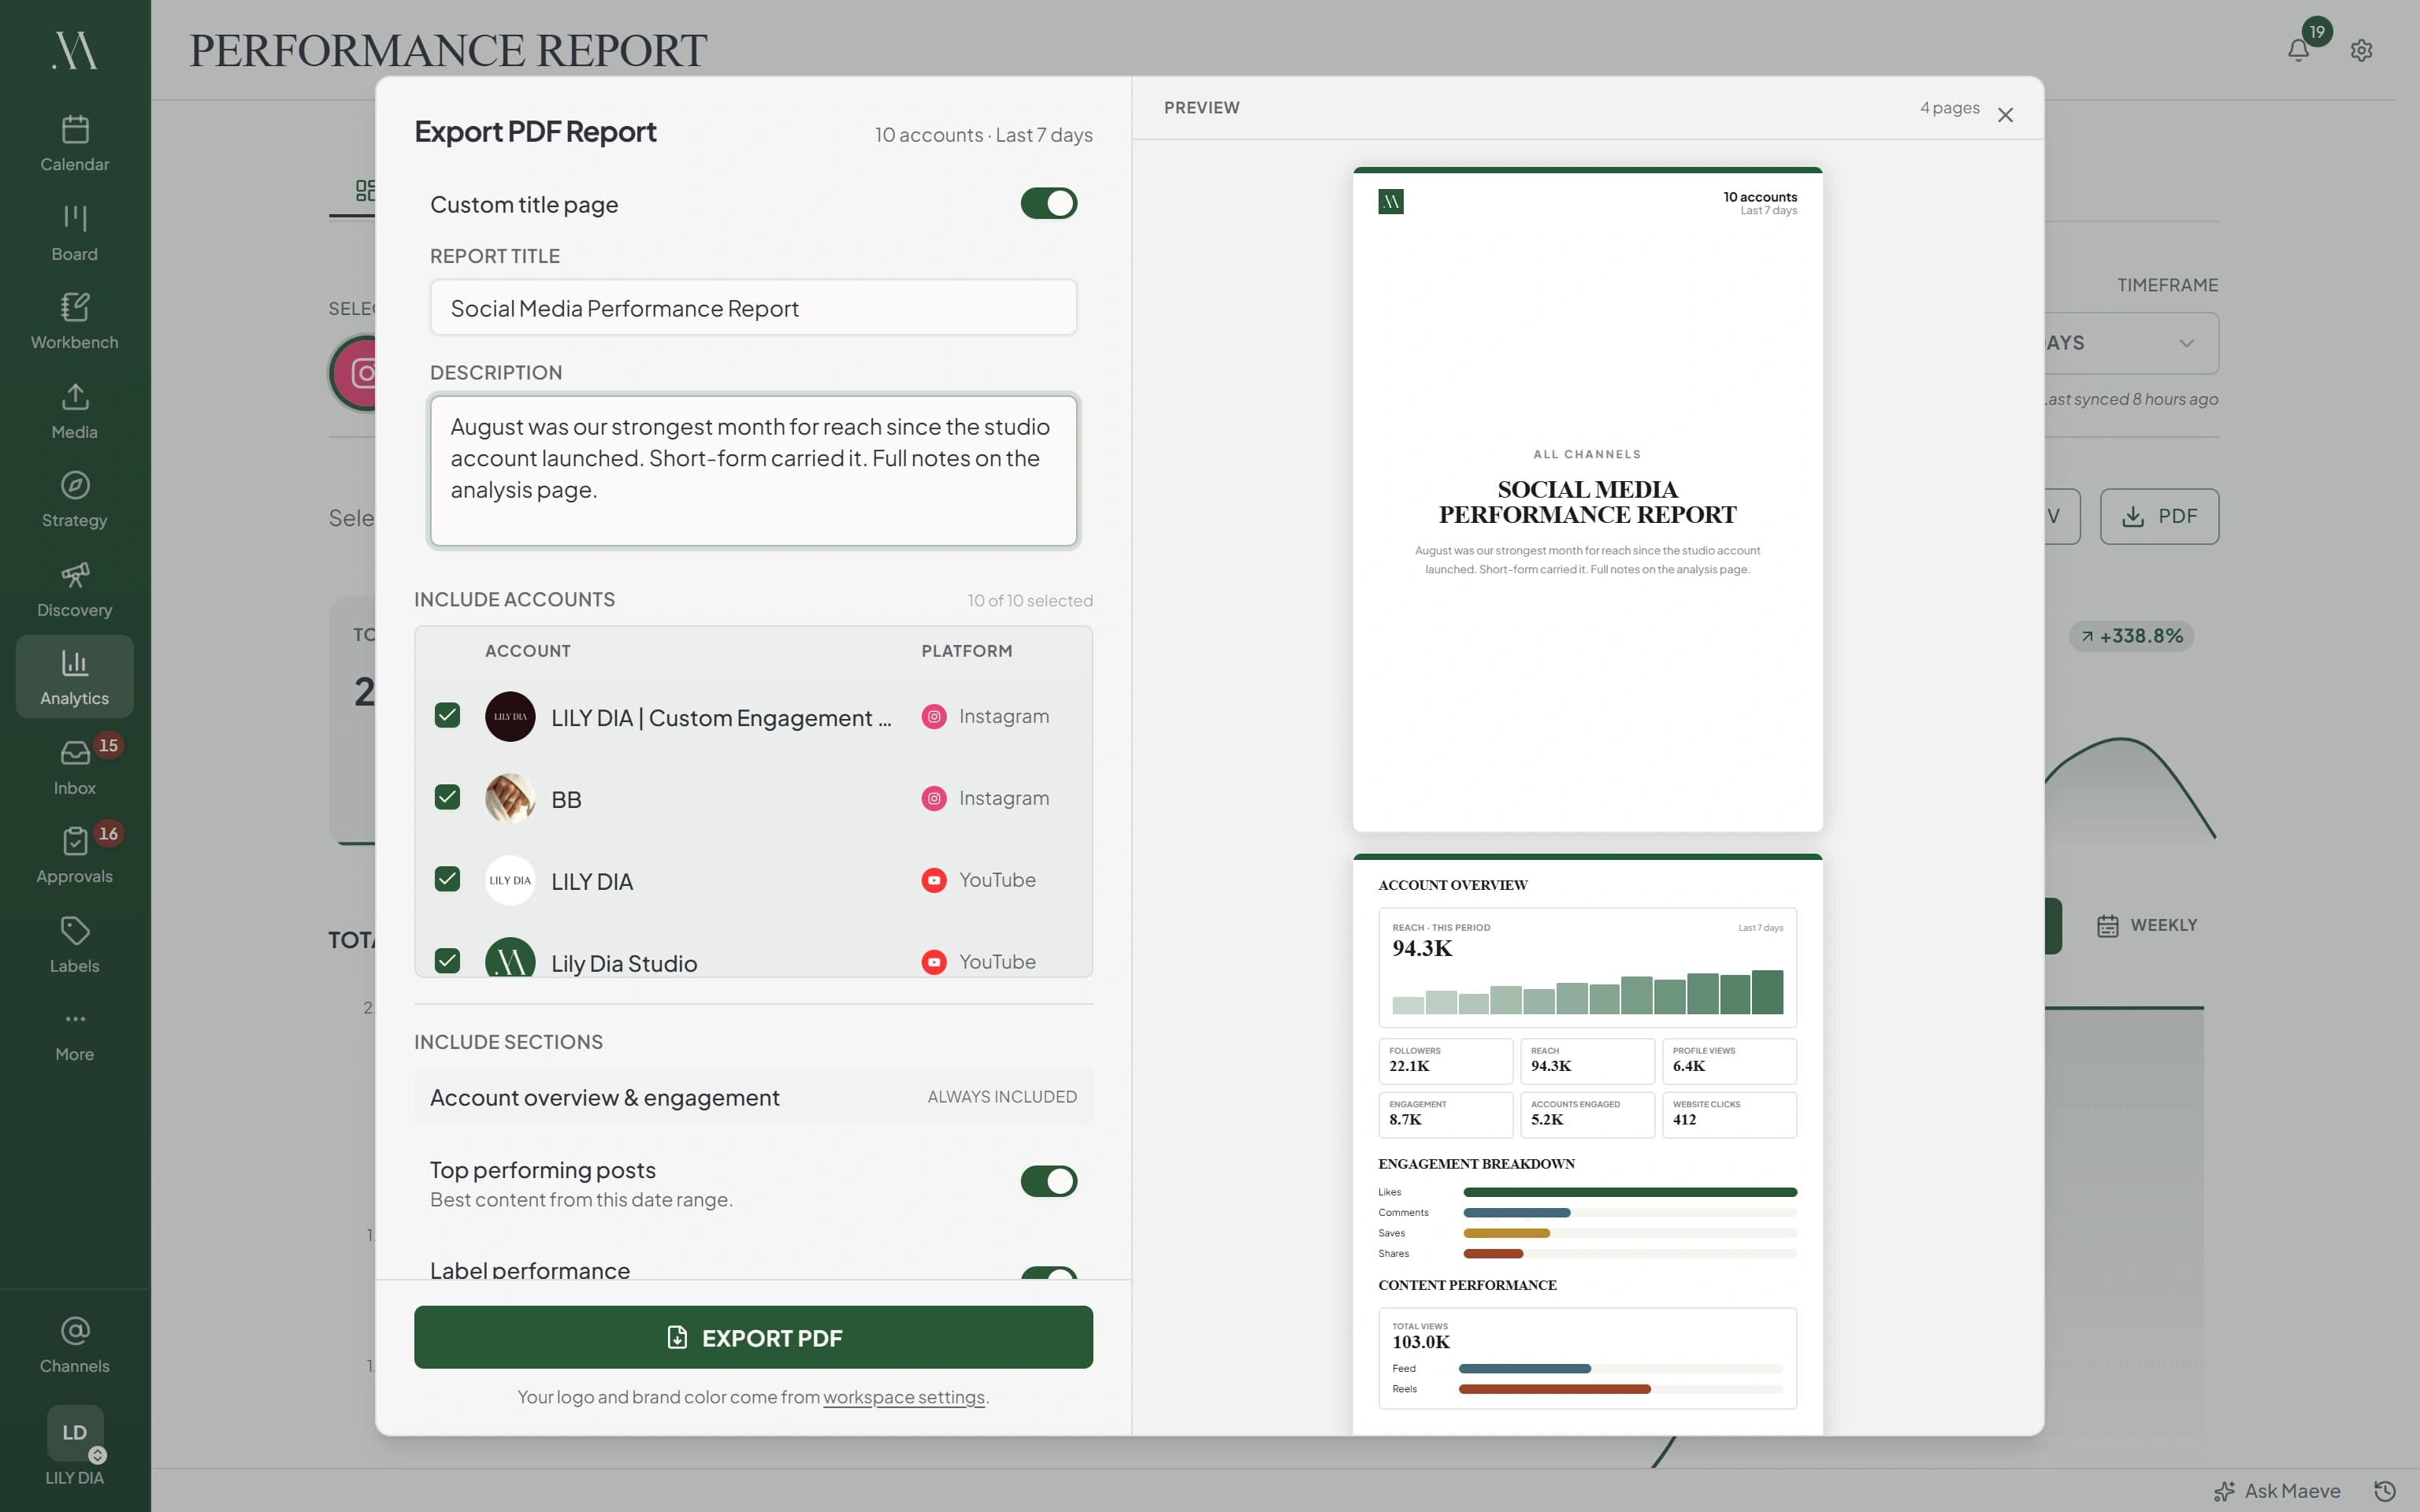
Choose the accounts and the sections, and the report builds in front of you. Your logo and your colour are on the cover.
One report can cover every channel or just one, and you can add your own write-up at the end. PDF reports are on Standard and Premium.
Or have it send itself
Set a report up once and Maeve emails it every week or month, built fresh each time from the latest numbers.
It lands in your client's inbox as an attachment, so there is nothing for them to log into. Pause it, edit it or send one again whenever you like.

Client reports
Lily Dia monthly
MonthlyReport sections
- Account overview and engagementAlways included
- Top performing contentOn
- Audience demographicsOn
- Label performanceOn
- Written summaryOff
Delivery
Sends on the 1st at 9:00 am
Covers last month, rebuilt with fresh numbers each time.
Emailed to
- hello@lilydia.com
- ops@lilydia.com
The PDF arrives as an attachment. Nobody needs a Maeve login.
Questions
Which networks have analytics?
Instagram, Facebook, YouTube, TikTok, Pinterest, Threads, LinkedIn and Google Business Profile. X does not report anything back, so it has no analytics in Maeve.
What is in the PDF?
A cover with your logo and brand colour, then the account overview and engagement, which is always included. Top performing content, audience demographics, label performance and your own written summary are switches. You see the real PDF in the preview before you download it.
Can one report cover more than one network?
Yes. Build the report from the All tab and it covers every account you tick, up to 20, with a channel performance section comparing them. You can also report on one network at a time.
Can Maeve send the report to my client for me?
Yes. Build a report once, choose weekly or monthly, add up to ten email addresses, and Maeve rebuilds the PDF with fresh numbers and emails it on the schedule you set. Your client does not need a Maeve login.
What date ranges can I look at?
7, 14, 30, 60 or 90 days, all time, or a custom range up to 366 days. Everything is compared against the period before it, so a 30 day view shows the change against the previous 30 days.
Can I export the numbers to a spreadsheet?
Yes. There is a CSV export beside the PDF button and on the tables, covering the metrics, the channel comparison, the label performance and your posts.
Why does engagement rate sometimes say unavailable?
Engagement rate needs reach, and only Instagram, Facebook and LinkedIn Pages report reach properly. Rather than divide by the wrong number, Maeve says the rate is unavailable for the accounts that cannot support it.
What audience data do I get?
Age, gender, top cities and top countries, plus the split between followers and people who engaged. Networks hold this back until an account is big enough, and each one shares a different amount. Facebook no longer gives age or gender at all.
Does it tell me when to post?
There is an engagement by posting time heatmap on every network, built from your own posts, and Instagram adds a chart of when your followers are online. Maeve shows you what happened rather than guessing a best time for you.
How fresh are the numbers?
Analytics sync daily, and opening the tab asks for a refresh if an account has gone stale. The timeframe picker shows when it last synced. Google reports its performance data two to three days behind, and a new connection starts with the last 30 days.
Are the report numbers the same as the dashboard numbers?
Yes. The PDF is built from the same analytics the dashboard reads, so if something looks wrong in the report it is wrong on screen too and you can chase it down.
What plan do I need?
Every paid plan gets the network dashboards. The All tab, PDF exports and scheduled client reports are on Standard and Premium. Everyone in the workspace can read analytics, including viewers.
Does it write the summary for me?
No. The written summary page is yours to write. There is no AI commentary and no competitor benchmarking, apart from TikTok's own industry comparison.